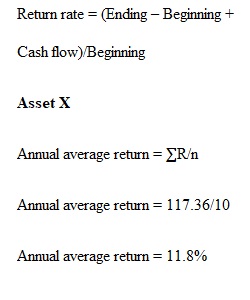
Q Junior Sayou, a financial analyst for Chargers Products, a manufacturer of stadium benches, must evaluate the risk and return of two assets, X and Y. The firm is considering adding these assets to its diversified asset portfolio. To assess the return and risk of each asset, Junior gathered data on the annual cash flow and beginning-and end-of-year values of each asset over the immediately preceding 10 years, 2006-2015. These data are summarized in the attached table . Junior’s investigation suggests that both assets, on average, will tend to perform in the future just as they have during the past 10 years. He, therefore, believes that the expected annual return can be estimated by finding the average annual return for each asset over the past 10 years. Junior believes that each asset’s risk can be assessed in two ways: in isolation and as part of the firm’s diversified portfolio of assets. The risk of the assets in isolation can be found by using the standard deviation and coefficient of variation of returns over the past 10 years. The capital asset pricing model (CAPM) can be used to assess the asset’s risk as part of the firm’s portfolio of assets. Applying some sophisticated quantitative techniques, Junior estimated betas for assets X and Y of 1.60 and 1.10, respectively. In addition he found that the risk-free rate is currently 7.0% and that the market return is 10.0%. Respond to the following: 1. Calculate the annual rate of return for each asset in each of the 10 preceding years, and use those values to find the average annual return for each asset over the 10-year period. 2. Use the returns calculated in part 1 to find (a) the standard deviation and (b) the coefficient of variation of the returns for each asset over the 10-year period. 3. Use your findings in part 1 and 2 to evaluate and discuss the return and risk associated with each asset. Which asset appears to be preferable? Explain.
View Related Questions